Utility Networks in 3D
Posted on: July 18, 2023
← Previous Post: Utility Network Assessment

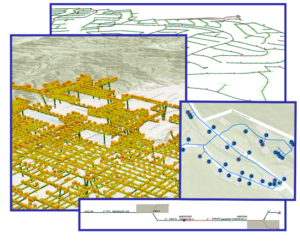
Historically, utility system visualizations have been done in 2D.
However, these 2D visualizations have inherent limitations in accurately representing typical system components; pipes come in varying sizes, valves are complex devices with several components and manholes are 3D structures with depth and have incoming and outgoing pipes at different elevations.
This map was developed to highlight the significant differences between 2D and 3D visualizations, particularly for utility systems.

This 3D model of a sewer lift station shows exactly where network features—such as pipes, cleanouts, and utility access holes—are, and what they look like. Users can navigate the scene, identify specific objects, and view related data.

Implementing this 3D approach has provided a broader understanding of the site and can be used to train employees in a virtual environment.
- Software: ArcGIS Pro
- Data Sources: DCSE Inc. & Victor Valley Wastewater Reclamation Authority
For an overview on 3D Modeling, please see the video below:


Have any thoughts and/or comments on this post? Feel free to share by posting below.
LOCATION
DCSE Inc.
23461 S. Pointe Drive
Suite 300
Laguna Hills, CA 92653
CONTACT
CALL (949) 465-3400
FAX (949) 586-8141
0 Comments