Posted on: February 6, 2024
In the field of modeling treatment plants within GIS, several key patterns have emerged, often referred to as vertical assets or building digital twins. These patterns encompass a range of techniques and technologies, including:
- CAD, BIM, and GIS Integration
- Point Cloud Integration with GIS
- ArcGIS Indoors Implementation
- Utility Network 3D Capability
- Leveraging Reality Capture in Conjunction with Utility Network
- The Synergy of BIM and Utility Network
Let’s delve into these patterns to understand their respective functions and operational mechanisms.
CAD, BIM, and GIS
In the CAD, BIM, and GIS pattern, data is acquired from CAD systems in the form of Building Information Modeling (BIM) and integrated into GIS using ArcGIS’s capability to import and display Revit files. Once the data is transferred to ArcGIS, it can be visualized using tools like the scene viewer or ArcGIS Experience Builder. The primary advantage of this approach is its ability to encompass all data, including concealed underground facilities not visible above ground. It is particularly effective for new facilities. However, implementing it for older facilities can be challenging due to the unavailability of BIM data. Additionally, this approach does not provide information on facility connectivity, as it lacks a network structure.
For more details on this approach, you can refer to the following link: ArcGIS Story Map.

Figure 1-Bim File Workspace Georeferenced – Article by Esri’s David Alvarez
Point Cloud and GIS
In the Point Cloud and GIS approach, the treatment plant facility is scanned using Lidar technology, generating a point cloud. Subsequently, a BIM model is created from this point cloud data, which can then be integrated into scenes viewable using ArcGIS Scene Viewer or Experience Builder. This method is particularly valuable when a BIM model is not available. A notable example of this approach is showcased in a video by Emily Champagne, GISP from the Milwaukee Metropolitan Sewerage District, at Esri’s 2023 IMGIS conference, accessible via the following link: MMSD Point Cloud and GIS Video.
MMSD’s implementation includes attaching documents to the modeled facilities, enhancing the viewing experience, and providing valuable insights into the systems of record, including asset management tools. Similar to the CAD, BIM, and GIS patterns, this approach does not provide data on facility connectivity due to the absence of a network structure.
ArcGIS Indoors
Indoor GIS is a solution for viewing buildings and their associated spaces and floors. Indoor GIS is a great tool for space planning and includes tools for indoor navigation and floor-based viewing of the data, which historically has been a challenge in viewing indoor data using GIS viewers. Indoor GIS has a data model incorporating floors into each feature to be displayed in a floor-aware GIS viewer (e.g., Esri’s Indoor Viewer). Space planning and campus planning are major focuses of ArcGIS Indoor. There are also navigation tools for iOS and Android that work in conjunction with indoor positioning system (IPS) and indoor network datasets helping users to find their way around a campus. In my opinion, ArcGIS Indoors is more appropriate for such applications where you need to map a university campus, hospital, mall, or, more commonly, an airport facility. The use of this technology for modeling water or wastewater treatment plants is limited. You can find out more about ArcGIS Indoors from the following:
https://www.esri.com/en-us/arcgis/products/arcgis-indoors/resources
This approach also does not provide any data on the connectivity of the facilities since no network is present. The term “indoor network dataset” refers to navigation and has nothing to do with ArcGIS Utility Network.
Utility Network 3D Capability
In Esri’s Utility Network 3D Capability, features within the network can be assigned z elevation values, allowing for 3D representation. This feature enables Utility Network datasets to seamlessly integrate into a 3D scene alongside other types of 3D data as a background. Furthermore, the Utility Network data model can be extended to accommodate vertical assets with the level of detail necessary for effective asset management. This makes the Utility Network an excellent choice for organizing data when modeling the utility network, including vertical assets at treatment or pump station facilities.
For instance, you can utilize this capability to perform tasks such as tracing a valve closure at a booster station to identify the facilities served by the zone controlled by that valve, especially when a booster station serves multiple pressure zones. Combining the Utility Network with other background data offers a robust solution for modeling vertical assets. However, it’s important to note that assigning Z elevation values may not be straightforward and require reference to as-built drawings. In some cases, estimations of Z elevation can be made for sewer-based Utility Networks using available elevation data and knowledge of an agency’s standard design specifications.

Figure 2 – 3D Sewer Utility Network
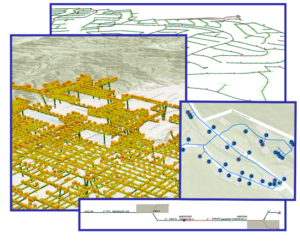
Reality Capture Combined with Utility Network
With this combined approach, you can visually explore the facility’s piping below the ground level, considering the z elevation of the features. Additionally, you can navigate and manage vertical assets using the Utility Network data model.

Figure 3 – Pump-Station Reality Capture Combined with Utility Network Produced by DCSE

BIM combined with Utility Network
Another approach involves combining the Utility Network (UN) with a BIM-generated Revit model. In this method, the Revit model and the UN data are both displayed in the scene viewer or ArcGIS Experience Builder. This approach offers several advantages, such as seamless synchronization of the 3D elevation of UN features with the Revit model, particularly beneficial for underground facilities. Additionally, it allows for the selection and navigation of UN features based on the UN vertical asset data model.
This approach is particularly ideal when the necessary data is available and can be effectively processed.

Have any thoughts and/or comments on this post? Feel free to share by posting below.
LOCATION
DCSE Inc.
23461 S. Pointe Drive
Suite 300
Laguna Hills, CA 92653
CONTACT
CALL (949) 465-3400
FAX (949) 586-8141
0 Comments