Posted on: August 5, 2022

Who would have thought 3D to be a serious tool for utility agencies?
Welcome to our 3rd blog post – and coincidentally, it’s on 3D ?. Seriously, who would have thought that Utility Network ushers in the age of 3D GIS with a Digital twin?
Working with 3D geometric network dataset was possible but not easy. 3D visualization prior to ArcGIS Pro was limited to adding your data in to ArcScene, and painstakingly displaying, navigating, or querying it. If any, we were lucky to get a good 3D map displaying a sewer system for example, or your water system infrastructure overlaid on the ground. Once we got a good view, we made a PDF and treasured it for a very long time.
Hence, historically the utility data visualizations have been done in 2D, with the geometric network. However, IRL (In Real Life), your infrastructure is not a flat pancake. Now don’t get us wrong, we love pancakes – for breakfast ? – but they are not ideal for utility GIS. Pipes have varying sizes, valves are complex devices with several components, manholes are 3D structures with depth, and they have incoming, outgoing pipes at different elevations. Think of your lift stations, or valve vaults…so why settle for 2D?
3D visualization of utilities can solve a lot the problems associated with the old 2D approach. It provides a better understanding of the complex underground networks and connections. We will show you some cool examples later in this post.
3D is here, and it is available now with the Utility Network!
Now what’s interesting about ArcGIS Utility Network is that it’s fully 3D-enabled. Once the utility network is implemented with 3D, the data management and visualization becomes so much more efficient and easier. You could even visualize your utility network with a full 3D imagery model—or you could call it a digital twin–of your facility. And that is exactly what we have done for one of our clients.
Let’s look at Figure 1 for example. This shows the Utility Network of a sewer system within and surrounding a sewer lift station in 2D. Nothing spectacular, ? it shows just a few lines, nodes – the utility network schema extended to support some treatment facilities.

Figure 1 – Utility Network Data on a 2D Map
Now, let’s look at this same Utility Network in 3D instead (Figure 2)… a little interesting ? – isn’t it? The Utility Network now shows all the associated heights and connections. You can exactly see where network features such as pipes, cleanouts, or manholes are. And this is possible because of ArcGIS Pro’s 3D capabilities. Notice how you can see the facilities within the gray wet well? In an ArcGIS Pro scene, you can navigate these effortlessly, change symbology, identify for attributes, and even drill down to identify related data.

Figure 2 – Utility Network Data – 3D View
And Drum Roll Please… ? Now let’s look at the Digital Twin – combination of this 3D utility network and the 3D Model that we prepared for this site (Figures 3 a-c). When you see this view of your data, you will have a better understanding of the dynamics and the connections in your infrastructure.
Click on thumbnails to expand these images in the gallery
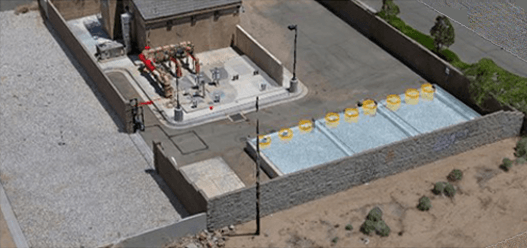
Figure 3a – Utility Network and 3D Model – Digital Twin (full area)
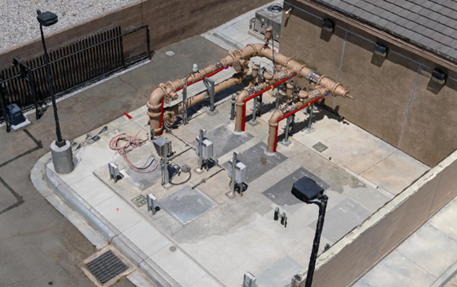
Figure 3b – Utility Network and 3D Model – Digital Twin (mid angle)
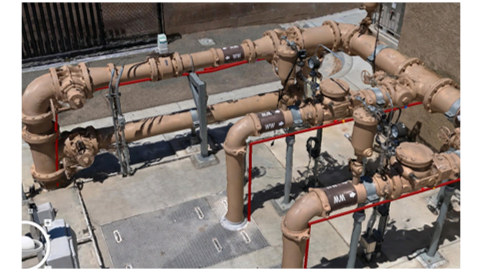
Figure 3c – Utility Network and 3D Model – Digital Twin (close-up)
Wondering how we made the full 3D model for the Digital Twin? We utilized AI-powered drones and digital cameras to gather input and imagery data for the model. The Utility Network data set also was refined based on the 3D Model so it served as a useful source dataset as well. We accurately positioned the devices, and realigned the pipes based on the model.
3D Model + Utility Network = Digital Twin for The Win!
As you can probably tell, these types of 3D Models combined with Utility Network give you the power of a digital twin in your hands that is easy to maintain and use.. a few Practical examples are :
-
- Use it as a digital counterpart to the physical structure allowing the user to view the utility infrastructure from multiple angles and perspectives.
- Make informed decisions based on complete visibility.
- Perform Condition assessments of the facilities with impressive detail.
- Train employees from the comfort of their desks without the need for visiting the actual site.
- Creating workorders on the correct device in the plant is possible and easy with 3D – you can navigate behind walls or within vaults to access the GIS features.
- Or you can click on a PRV in your 3D model and open its historical SCADA chart to troubleshoot operations.
The possibilities are exciting and the potential is endless – What could you do with a digital twin? Do you think your agency can benefit from a 3D model? Would you like to level up your 2D Utility data with the power of Z?
Do let us know – We are interested in hearing from you.
Warm Regards,
The “3D” Network Nerds at DCSE

Have any thoughts and/or comments on this post? Feel free to share by posting below.
1 Comment
Submit a Comment
LOCATION
DCSE Inc.
23461 S. Pointe Drive
Suite 300
Laguna Hills, CA 92653
CONTACT
CALL (949) 465-3400
FAX (949) 586-8141
Advent of 3D in Geospatial platforms especially in Utilities and many others would prove very beneficial with advancements in ArcGIS Pro, and IT etc. allowing in real life like planning, facility management using virtual Digital Twins! Great potential ahead!
Very Good blog post! Keep it up!
Thanks and regards